Making activeCollab project reporting even more useful
Reports Plus was our first activeCollab extension and also one of our most popular products. Last year we ported it to HTML (from Flash) and added financial reporting. We now wanted to make it even more useful and started thinking afresh.
The result of that thinking and a few iterations is available to all. Here’s a summary of what we have changed and why…
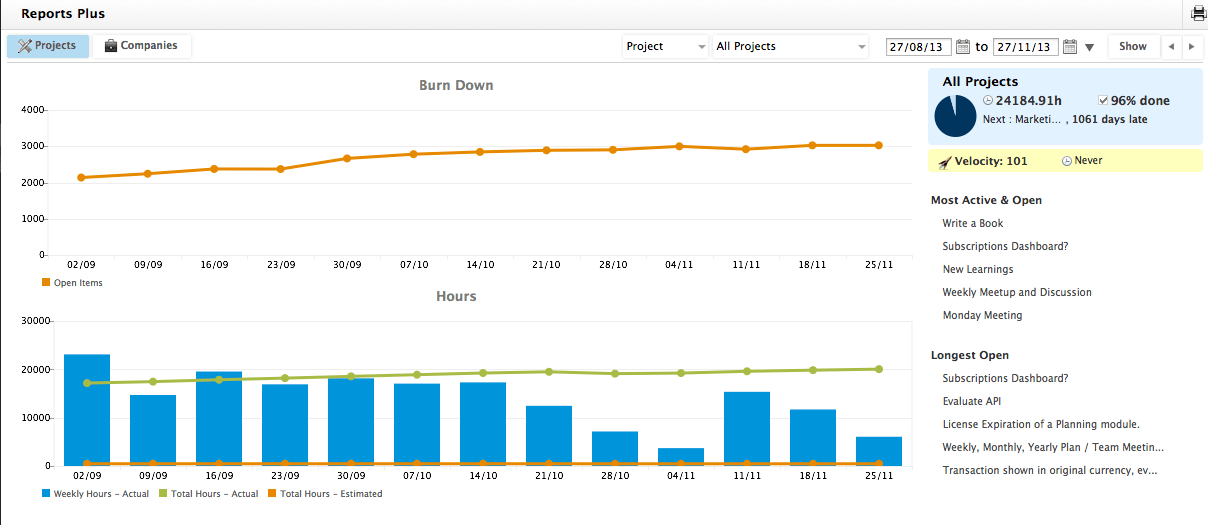
BEFORE: Project Reports – Velocity, Burn Down, Hours and more
AFTER: Revamped Project Reports
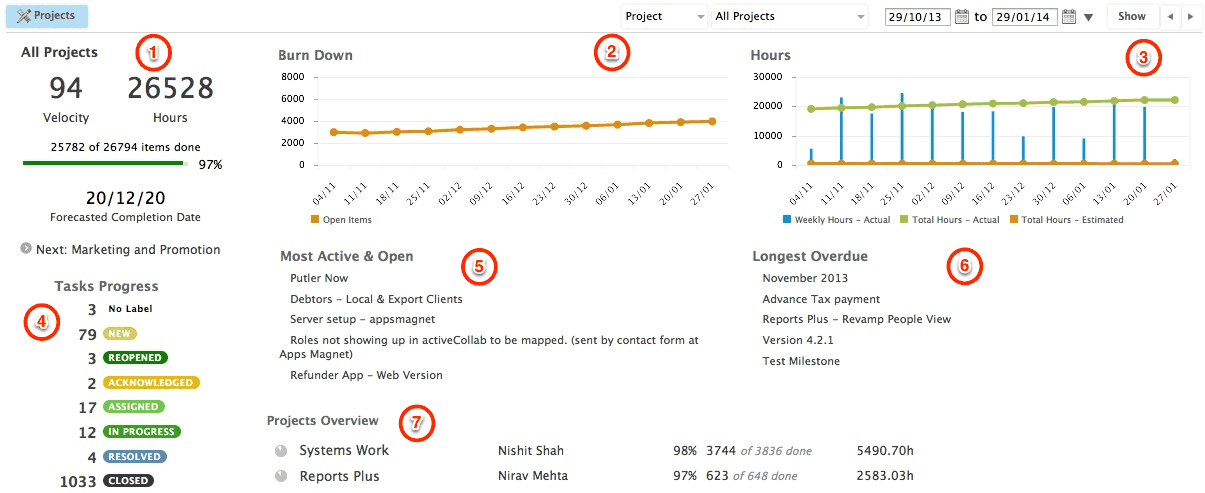
1. Key Performance Indicators
We moved Key Performance Indicators to left and highlighted velocity and hours. We felt those are the two most important numbers to track. The project progress indicator was switched to a simpler bar and we added a clear label for the forecasted completion date. Next milestone is played down, but available for anyone who wants to see what’s coming next (this is especially useful in individual projects)
2. Burn Down Chart
The most important thing about a burn down chart is the slope at which it is going down – indicating the velocity at which the project is moving and giving you an estimate of when the project is likely to complete. Earlier it took the full width of the screen. It is now smaller, but still conveys all important information.
3. Hours Chart
Hours chart shows weekly tracked hours, total estimated hours and total tracked hours till date. We trimmed this chart too – and even made the columns slimmer! Hovering your mouse over any circle reveals more information.
4. Tasks Progress
This is a new block we added to project reports. In activeCollab 2 days, we showed tasks in different categories, but workflow labels provide a more accurate representation of task status. Custom workflow labels and their colors will be the same across the system.
5. Most Active & Open
The list of most actively worked upon tasks was not given priority earlier. It is now right in front center. This list tells you which work is keeping your team occupied currently.
6. Longest Overdue
The other important list is tasks that are overdue for a long time. These are items that either need some love to complete them, or an edit that removes the due date on them!
7. Project Status Overview
The project status overview block comes only for collections of projects – for instance when you’re viewing report for “All Projects” or projects for a particular company. This was earlier a new tab in its own but we’ve merged it with project reports. The list is easy to read – shows overall progress, project name, leader name, percentage completion, number of tasks done and total tasks, total hours tracked – and optionally the next milestone in this project.
System Stats
Not visible in this screenshot are quick stats about the system – total projects, users, files, their size etc. This block was only in companies tab earlier, and is now moved to project reports, below the tasks progress block.
Do you think these changes make reports more usable?
Do you like these changes? Do they make it easier to get a sense of how well your projects are doing? What would you like us to improve further?
Post a comment and let us know!


