Frequency of scheduled task – is once a week ok?

February 17, 2009

Got a question from a customer:
I am setting up a cron using a third party service. Do I have to set cron to execute the tasks both frequently, hourly and daily (or is it sufficient once a week?)

Our Answer:

If you set up frequently, hourly and daily it will make activeCollab happy! (The new Incoming Mail module uses frequently job to pull emails).

For Reports, once a week is sufficient, but you will need to ensure it gets called on the day your week starts (as per aC configuration you have). Webcron.org may be in some other timezone than your server. So you will need to ensure it gets fired at correct time. When cron gets executed, it checks if this is the start of the week, if so, it will take reporting snapshots.

Every week, on start of week (e.g. Monday) we take snapshot of previous week.

Scheduled Tasks – what if my server does not support cron?

February 17, 2009

If your host does not have crontab / scheduled task enabled, your reporting data will not update. For best results you should have Scheduled Tasks configured and working for activeCollab.

If your server has a web based control panel (cPanel, Plesk etc), there are good chances you can configure cron jobs with it. If you have shell access to the server (SSH), you can easily configure cron jobs from command line (crontab -e).

If all that fails, what are my alternatives?

Alright, so life is really making it difficult for you, you have two alternatives.

  1. Re-install Reports module every week. When Reports module installs, it collects all historical data about your projects. Re-installing it (uninstall, and then install) will refresh your data.
  2. Run cron from another computer. Either set it up on your desktop or use a third party service to run scheduled tasks (e.g. Webcron.org). Just ensure your are using correct URLs of your activeCollab installation. Reports module needs the daily cron / scheduled task to be executed.

Reports icon not showing in Access theme

February 17, 2009

If you are using Access theme with activeCollab, Reports icon does not show up in main menu. You do see a menu item and can click on it, but it is missing an icon.

Why does this happen?

Access theme uses a custom CSS file to override look and feel of activeCollab. By default it hides any unknown styles. They do not have an icon for Reports module yet. This results in no icon showing for Reports module.

How to fix it?

It’s easy to fix this. Here are the steps:

  1. Copy public/assets/modules/reports/images/icon.gif to public/assets/themes/Access/images/icons/reports.gif. Note we are copying as reports.gif, not icon.gif.
  2. Edit theme.css in public/assets/themes/Access/. Search for #menu_item_status in it. It may have another line for invoicing module after it. Add this line: #menu_item_reports span.outer {background: transparent url(images/icons/reports.gif) no-repeat center 15px;}
  3. Save the file and exit.
  4. Refresh your activeCollab page. Reports icon should now show up.
  5. If it does not, check permissions on reports.gif that you copied. Ensure it has same permissions as other images in icons folder.
  6. If you notice that the icon is not positioned properly in the menu, ensure you have used 15px and not 10px like other Access theme icons.

If this does not work, post a comment here with some more details and we will sort out!

BTW,  we have already requested Leon (Access theme developer) to include a Reports icon. We are still to hear from him.

Demo video: Reports Module for activeCollab Project Management System

February 12, 2009

Want to see how the reports module looks? Here’s a quick demo video showing you installation, configuration and usage of our reports module for activeCollab project management system.

What do you think?

Are you ready to buy? It’s just $39!

Buy Now

Reports Module Documentation

February 12, 2009

Welcome to this introduction to Reports module for activeCollab. In this quick article, we will see how to install, use and make decisions with this exciting new module for activeCollab – a superb project management system.

reports-overview-scaled

Let’s get started.

Documentation Subjects

Click on a subject to learn more about it.

Introduction Video

We have a superb introductory video on Reports module. In well under 5 minutes, you can learn how to setup and use Reports module with your activeCollab setup!

Need Support? Have an idea?

Do you have some feedback for us? An idea to improve? Some problem we missed out? We are eager to listen. Please give us your feedback.

Filtering by dates, Navigating projects and Legends

February 12, 2009

Reports Dashboard Options

Filter by Dates

date-range

You can filter reporting period by selecting dates in two date selectors at top. The first is starting date and second is end date. Click on the calendar next to a date field to select another date. Click on Refresh button to reload reports for this date range.

Navigating Projects

projects-list

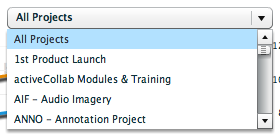
At the top of your Reports Dashboard, you will see a drop down list of projects you have access to. Select any project from this list and click on Refresh to update reports.

next-buttonWe anticipated that you may want to review all your projects once a week. We simplified this operation with the Next button. Click on Next to load reports for next project in your list. Review reports and click Next again to move to another project.

Legends

legend-visible

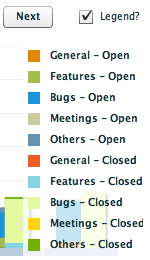
We did not want legends to obstruct your view, so we kept them hidden. You can toggle them by checking the Legend box at top right. When on, this will show you color code legends for all your charts.

How do we create these reports?

February 12, 2009

Background Magic

reports-snapshot

We create these reports by taking a snapshot of your projects. We store reporting trends for last week at the start of each week. This is how we get weekly progress reports. And this is the reason why we need Scheduled Tasks running!

This data – burndown, iteration, hours – is not updated during a week. So if you come back to these reports during a week, you will not see any updates. The only real time data is Most Active Tickets and Longest Open Tickets.

Project Velocity

February 12, 2009

Project Velocity

velocity

Velocity is the number of tickets closed last week. Burn down chart’s Closed Tickets line is your velocity trend. Project Velocity is one of your best measurement of project progress. A high number means team is progressing well.

Velocity can be linked to different parameters. Some project management methodologies calculate it by dividing estimated time with actual time. Since we don’t have a way to estimate time in activeCollab yet, we are simply using ticket counts.

Put this to use!
Track your velocity trend. If it falls, it means there is some struggle with, things have slowed down. It could be waiting for client feedback or some risks that have come up. If nothing else, you should track velocity on your projects.

Longest Open Tickets

February 12, 2009

Longest Open Tickets

longest-open-tickets

Tickets that are open for longest duration – along with number of days they have been open for.

Put this to use!
Longest tickets may mean work your team is struggling with or neglecting. Are these tickets important? Longest tickets could also show items that you use for recurring activities like meetings. May be they are risks that have not yet been addressed. Work on closing them at priority!

Most Active Tickets

February 12, 2009

Most Active Tickets

most-active-tickets

Which tickets have most comments back and forth? Which are updated most frequently? Most active tickets show 5 tickets with highest activity.

Put this to use!
Active tickets could be unclear work items. Does the team need help on them? Or are they items that needed focus and are getting it now?